

Article summary
The break-even analysis formula divides fixed costs by contribution per unit to find the sales volume at which operating profit is zero in a simplified cost-volume-profit model. Contribution per unit is selling price minus variable cost. This guide works one fictional product from inputs to a chart, then changes a cost assumption so you can check how the answer moves.
The formulas and their inputs
| Measure | Formula | Unit |
|---|---|---|
| Contribution per unit | Price per unit - variable cost per unit | INR per unit |
| Break-even units | Fixed costs / contribution per unit | Units |
| Contribution-to-sales ratio | Contribution per unit / price per unit | Decimal or percentage |
| Break-even sales | Fixed costs / contribution-to-sales ratio | INR |
| Operating profit | Units sold x contribution per unit - fixed costs | INR |
Use costs and sales from the same period. Fixed means fixed within the activity range being modelled, not fixed forever. If contribution is zero or negative, the ordinary positive break-even formula cannot give a viable volume for recovering positive fixed costs. Check cost behaviour before calculating.
Worked example: one fictional workshop product
An invented workshop plans a single product for one month. Price is INR 500 per unit, variable cost is INR 300 per unit and fixed operating costs are INR 120,000. Assume units made are sold, price stays constant, and there are no taxes, financing costs or inventory movements. These are learning assumptions rather than a real business forecast.
- Contribution = 500 - 300 = INR 200 per unit.
- Break-even units = 120,000 / 200 = 600.
- Contribution-to-sales ratio = 200 / 500 = 40%.
- Break-even sales = 120,000 / 0.40 = INR 300,000.
- At 600 units: revenue 300,000 - variable costs 180,000 - fixed costs 120,000 = zero profit.
Read the break-even chart
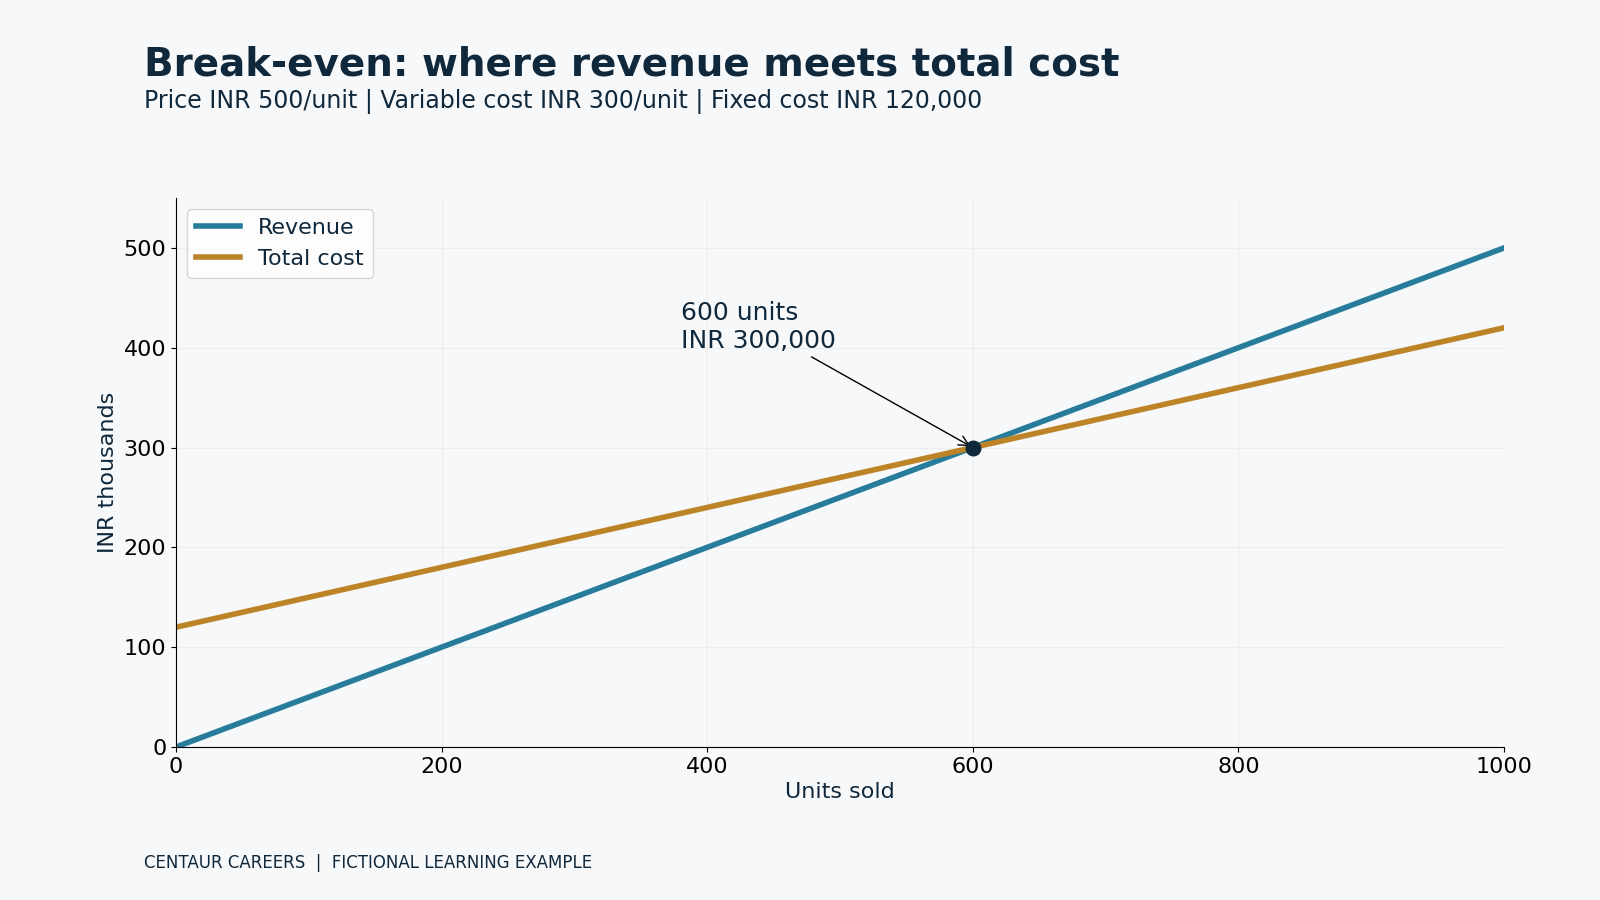
The revenue line starts at zero because this model earns no revenue without sales. Total cost starts at INR 120,000 because the assumed fixed costs exist at zero units. Above 600 units, revenue exceeds total cost; below it, the business records an operating loss. The vertical gap measures modelled operating profit or loss, not the bank balance.
| Units | Revenue INR | Total cost INR | Profit INR |
|---|---|---|---|
| 0 | 0 | 120,000 | -120,000 |
| 400 | 200,000 | 240,000 | -40,000 |
| 600 | 300,000 | 300,000 | 0 |
| 800 | 400,000 | 360,000 | 40,000 |
| 1,000 | 500,000 | 420,000 | 80,000 |
Margin of safety at 800 units
At expected sales of 800 units, the margin of safety is 800 - 600 = 200 units. Dividing by expected sales gives 200 / 800 x 100 = 25%. Expected revenue is INR 400,000, so the sales-value margin is INR 100,000. This expresses the room before sales reach break-even under the model; it is not a probability that the plan will succeed.
Sensitivity: variable cost rises to INR 350
Hold price and fixed costs unchanged and raise variable cost to INR 350. Contribution falls to INR 150 per unit. Break-even rises to 120,000 / 150 = 800 units, and profit at the original 800-unit plan falls to zero. Changing one assumption while holding the others fixed isolates its effect; it does not establish that demand or other costs will actually stay unchanged.
Limitations of break-even analysis
- Capacity limits and extra shifts can introduce steps in fixed costs.
- A multi-product business needs an explicit sales-mix assumption.
- Bulk discounts, waste or overtime can change variable costs.
- Customer credit, supplier timing, capital spending and debt payments can make cash differ from operating profit.
- For indivisible units, round a fractional break-even volume up and verify profit at that volume.
A spreadsheet task with a checked answer
Place the three inputs in labelled cells and build the volume table. Change fixed costs to INR 150,000 while returning variable cost to INR 300. Break-even becomes 750 units and profit at 800 units becomes INR 10,000. Retain the base case beside the changed scenario and explain the input change. A reviewer should be able to reproduce both answers without guessing which figures are assumptions.
Compare cost accounting methods before classifying inputs
Source and scope
ACCA provides background on contribution, break-even calculations and model assumptions. The workshop data, chart and sensitivity exercise here are original. A real decision also needs evidence about demand, capacity, cash and actual cost behaviour.
ACCA: cost-volume-profit analysis
Are break-even sales and break-even units the same?
No. Units measure volume; sales measure revenue. Here 600 units at INR 500 each equal INR 300,000 of sales.